https://redmine.openinfosecfoundation.org/projects/suricata/wiki/_logstash_kibana_and_suricata_json_output
With the release of Suricata 2.0rc1 , Suricata introduces all JSON output capability.
What is JSON – http://en.wikipedia.org/wiki/JSON
One way to handle easily Suricata’s JSON log outputs is through Kibana – http://kibana.org/ :
Kibana is a highly scalable interface for Logstash (http://logstash.net/) and ElasticSearch (http://www.elasticsearch.org/) that allows you to efficiently search, graph, analyze and otherwise make sense of a mountain of logs.
The installation is very simple/basic start up with minor specifics for ubuntu. You can be up and running, looking through the logs in under 5 min.
The downloads can be found here – http://www.elasticsearch.org/overview/elkdownloads/
This is what yo need to do.
Suricata
Make sure your Suricata is compiled/installed with libjansson support enabled:
$ suricata --build-info
This is Suricata version 2.0 RELEASE
Features: NFQ PCAP_SET_BUFF LIBPCAP_VERSION_MAJOR=1 AF_PACKET HAVE_PACKET_FANOUT LIBCAP_NG LIBNET1.1 HAVE_HTP_URI_NORMALIZE_HOOK HAVE_NSS HAVE_LIBJANSSON
...
  libnss support:                          yes
  libnspr support:                         yes
  libjansson support:                     --> yes <--
  Prelude support:                         no
  PCRE jit:                                no
  libluajit:                               no
  libgeoip:                                yes
  Non-bundled htp:                         yes
  Old barnyard2 support:                   no
  CUDA enabled:                            no
...
If it isn’t check out the Suricata_installation page to install or compile Suricata for your distribution.
NOTE: you will need these packages installed -> libjansson4 and libjansson-dev before compilation.
Configure suricata
In your suricata.yaml
  # "United" event log in JSON format
  - eve-log:
      enabled: yes
      type: file #file|syslog|unix_dgram|unix_stream
      filename: eve.json
      # the following are valid when type: syslog above
      #identity: "suricata"
      #facility: local5
      #level: Info ## possible levels: Emergency, Alert, Critical,
                   ## Error, Warning, Notice, Info, Debug
      types:
        - alert
        - http:
            extended: yes     # enable this for extended logging information
        - dns
        - tls:
            extended: yes     # enable this for extended logging information
        - files:
            force-magic: yes   # force logging magic on all logged files
            force-md5: yes     # force logging of md5 checksums
        #- drop
        - ssh
        - smtp
        - flow
Install ELK (elasticsearch, logstash, kibana)
First install the dependencies
(
NOTE:
ELK recommends running with Oracle Java – how to ->
http://www.elasticsearch.org/guide/en/elasticsearch/reference/current/setup-service.html#_installing_the_oracle_jdk
)
Otherwise you can install the openjdk:
apt-get install apache2 openjdk-7-jdk openjdk-7-jre-headless
Then download and install the software.
Make sure you download the latest versions –
http://www.elasticsearch.org/overview/elkdownloads/
The installation process is simple (for example):
wget https://download.elasticsearch.org/kibana/kibana/kibana-3.0.0.tar.gz
wget https://download.elasticsearch.org/elasticsearch/elasticsearch/elasticsearch-1.6.1.deb
wget https://download.elastic.co/logstash/logstash/packages/debian/logstash_1.5.3-1_all.deb

tar -C /var/www/ -xzf kibana-3.0.0.tar.gz
dpkg -i elasticsearch-1.6.1.deb
dpkg -i logstash_1.5.3-1_all.deb
Logstash configuration
Create and save a logstash.conf file with the following content in the /etc/logstash/conf.d/ directory :
touch /etc/logstash/conf.d/logstash.conf
Insert the following(make sure the directory path is correct):
input {
  file {
    path => ["/var/log/suricata/eve.json"]
    sincedb_path => ["/var/lib/logstash/"]
    codec =>   json
    type => "SuricataIDPS"
  }

}

filter {
  if [type] == "SuricataIDPS" {
    date {
      match => [ "timestamp", "ISO8601" ]
    }
    ruby {
      code => "if event['event_type'] == 'fileinfo'; event['fileinfo']['type']=event['fileinfo']['magic'].to_s.split(',')[0]; end;"
    }
  }

  if [src_ip]  {
    geoip {
      source => "src_ip"
      target => "geoip"
      #database => "/opt/logstash/vendor/geoip/GeoLiteCity.dat"
      add_field => [ "[geoip][coordinates]", "%{[geoip][longitude]}" ]
      add_field => [ "[geoip][coordinates]", "%{[geoip][latitude]}"  ]
    }
    mutate {
      convert => [ "[geoip][coordinates]", "float" ]
    }
    if ![geoip.ip] {
      if [dest_ip]  {
        geoip {
          source => "dest_ip"
          target => "geoip"
          #database => "/opt/logstash/vendor/geoip/GeoLiteCity.dat"
          add_field => [ "[geoip][coordinates]", "%{[geoip][longitude]}" ]
          add_field => [ "[geoip][coordinates]", "%{[geoip][latitude]}"  ]
        }
        mutate {
          convert => [ "[geoip][coordinates]", "float" ]
        }
      }
    }
  }
}

output {
  elasticsearch {
    host => localhost
    #protocol => http
  }
}
Configure the start-up services
update-rc.d elasticsearch defaults 95 10
update-rc.d logstash defaults

service apache2 restart
service elasticsearch start
service logstash start
Enjoy
That’s all. Now make sure Suricata is running and you have logs written in your JSON log files and you point your browser towards ->
http://localhost/kibana-3.0.0
NOTE:
Some ready to use templates – Templates for Kibana/Logstash to use with Suricata IDPS
From here on if you would like to customize and familiarize yourself more with the interface you should read the documentation about Kibana and Logstash.
Please have in mind that this is a very quick(under 5 min) tutorial. You should customize and review the proper way for you of using it as a service and/or consider using httpS web interface and reversy proxy with some authentication.
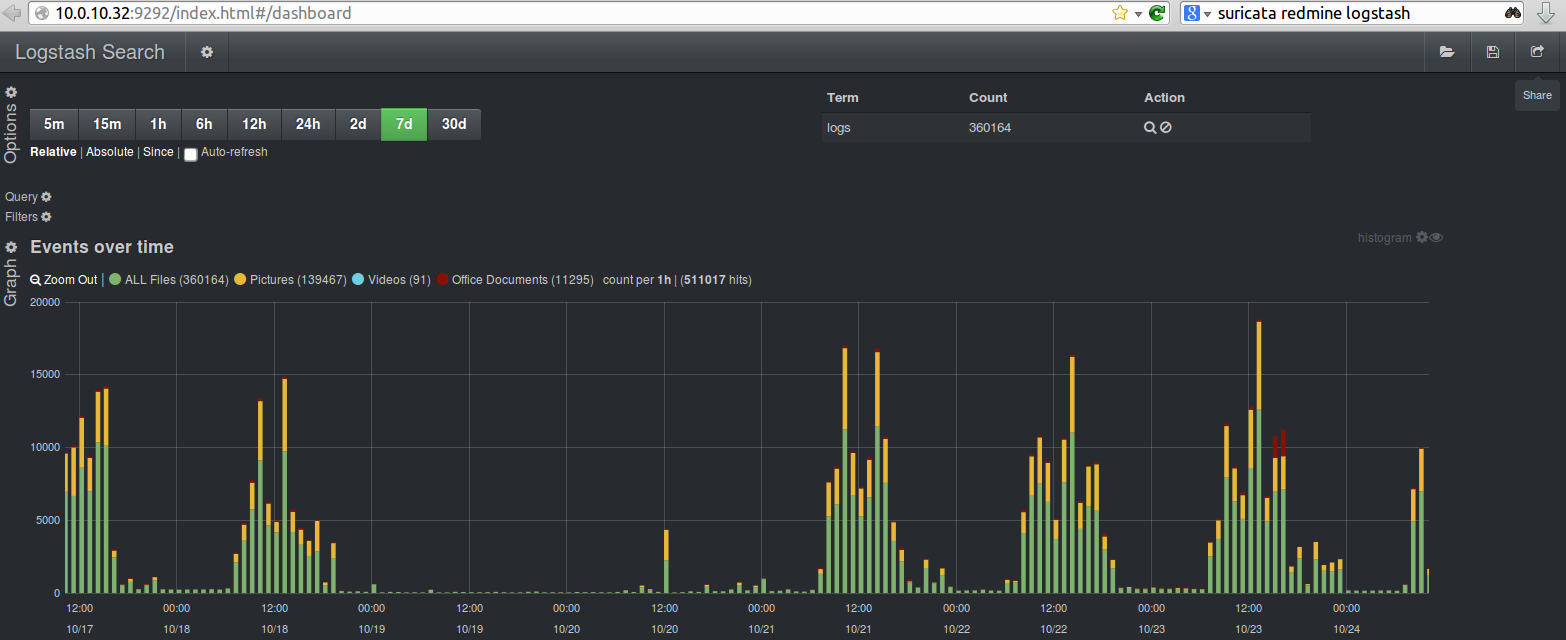
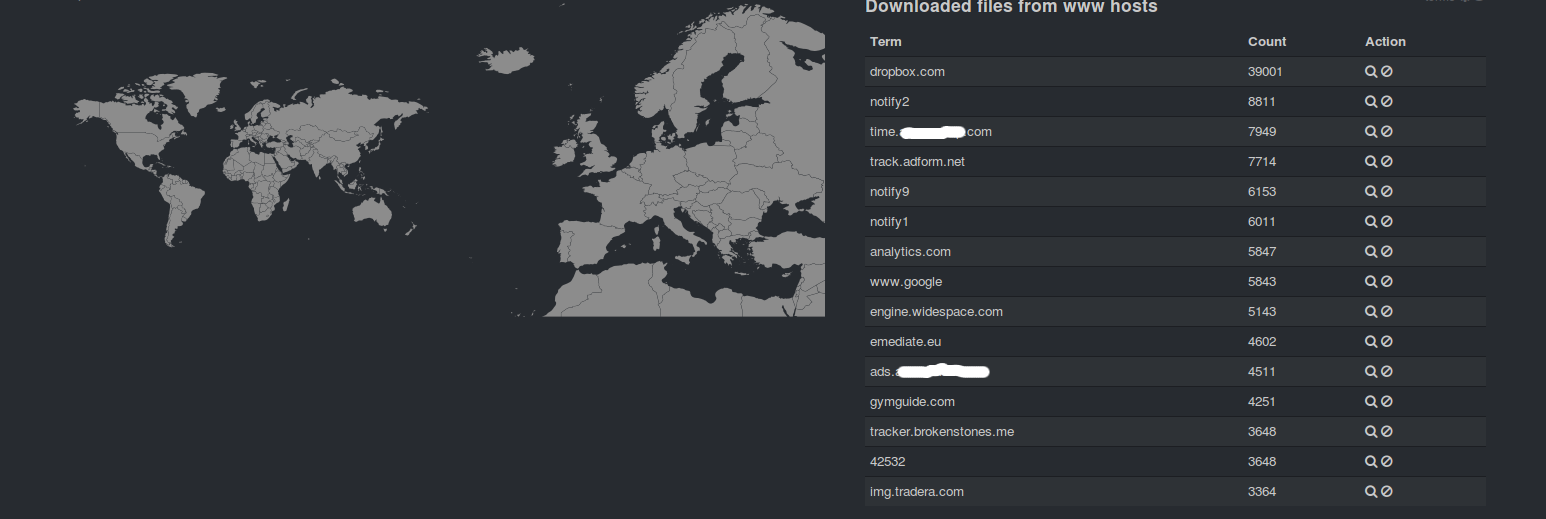
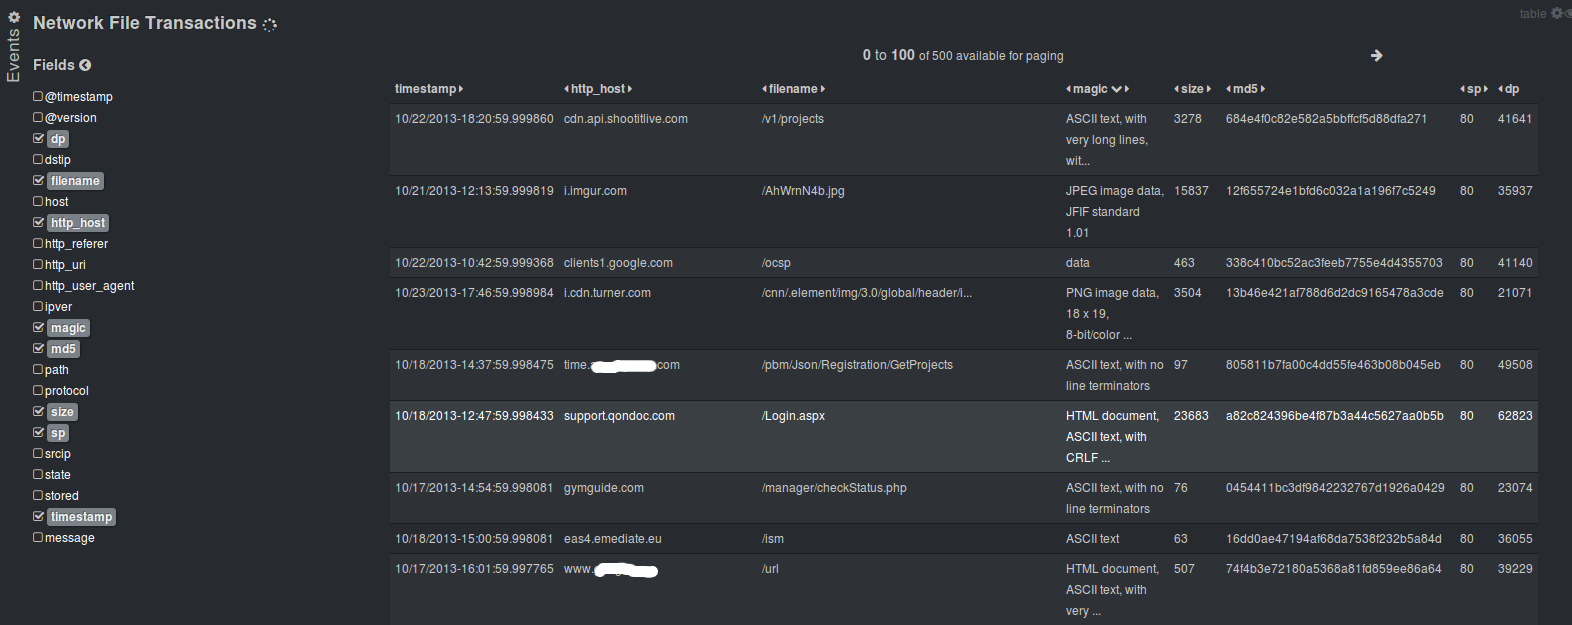
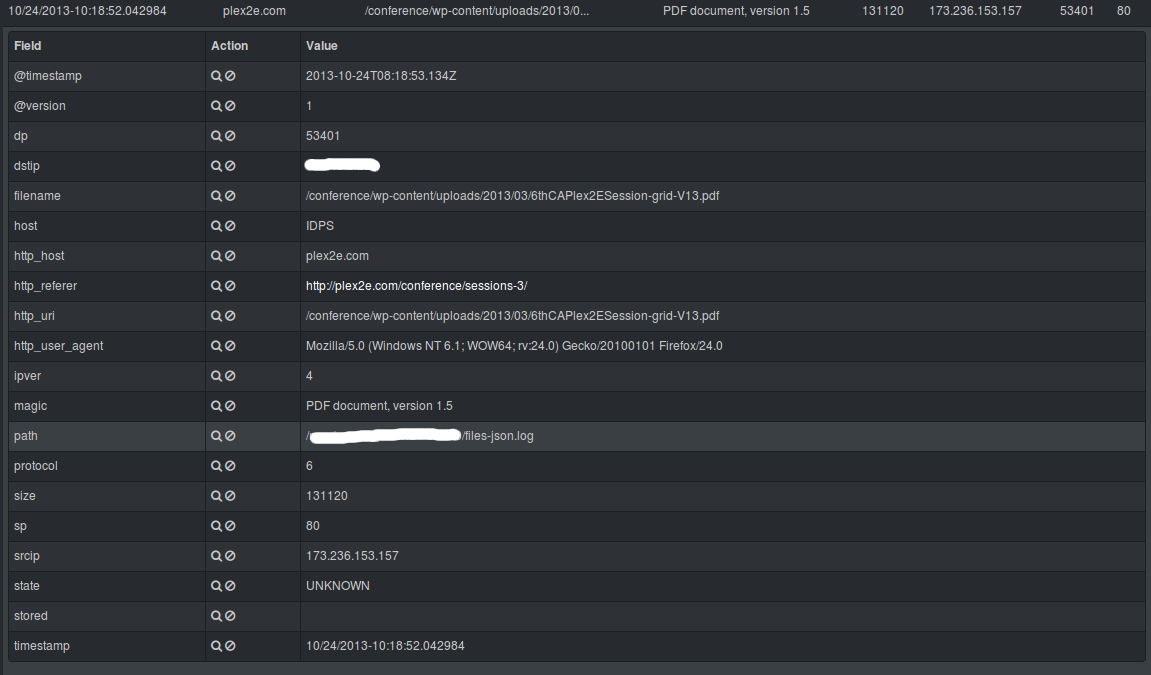
Some possible customization of the output of Logstash and Kibana – >